Analytic Information
Business Segments - Key Figures
|
Local Infrastructure |
Central Infrastructure |
Security |
Other |
|||||
| Amounts in NOK million | 2011 | 2010* | 2011 | 2010* | 2011 | 2010* | 2011 | 2010* |
| Profitability | ||||||||
| Operating revenues | 1 989 | 1 858 | 611 | 579 | 306 | 316 | 13 | 31 |
| Purchased materials | (959) | (862) | (281) | (253) | (93) | (95) | - | - |
| Salaries and other personnel exps. | (679) | (633) | (229) | (204) | (132) | (129) | (20) | (24) |
| Other operating exps. | (239) | (244) | (82) | (66) | (56) | (55) | (6) | (34) |
| Operating profit before depreciation | 112 | 118 | 19 | 56 | 27 | 37 | (13) | (28) |
| Operating profit | 86 | 93 | 12 | 49 | 23 | 33 | (20) | (33) |
| Operating margin | 4.3% | 5.0% | 2.0% | 8.5% | 7.6% | 10.5% | -156.7% | -109.2% |
| Additional key figures | ||||||||
| Operating investments | 31 | 22 | 5 | 10 | 1 | 1 | 8 | 12 |
| Capital employed | 209 | 155 | 92 | 88 | 113 | 114 | (216) | 43 |
| Number of employees (as of 31 dec.) | 1 120 | 1 253 | 366 | 381 | 202 | 211 | 17 | 16 |
| Number of man-years (as of 31 dec.) | 1 115 | 1 243 | 360 | 378 | 201 | 210 | 16 | 15 |
* Restated figures as a result of change in accounting principle for pension, see note 2 to the group accounts for further information.
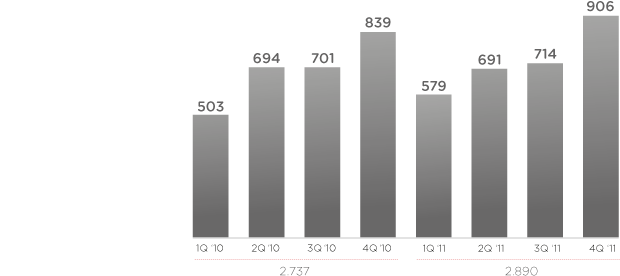
Revenues per quarter
Amounts in NOK million
Business Segments - Key Figures
Amounts in NOK million
Key figures Group
| Amounts in NOK million | Definition | 2011 | 2010 |
 |
|||
| Profitablility | |||
| Operating revenues | 2 890 | 2737 | |
| Operating profit before depreciation | 144 | 184 | |
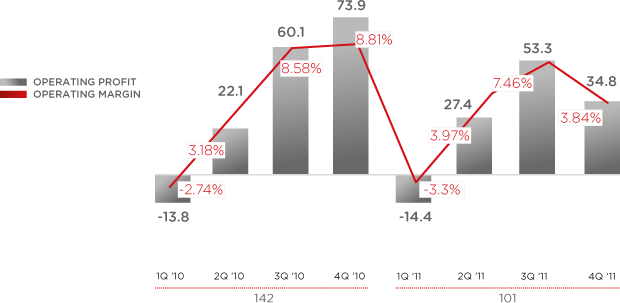
| Operating profit | 101 | 142 | |
| Operating profit before tax | 100 | 143 | |
| Profit, discontinued operations | 1 | (3) | - |
| Profit for the year | 71 | 104 | |
| Operating margin, incl. gain on sale of alarm portfolio | 2 | 3.5% | 5.2% |
| Cash Flow | |||
| Net cash flow from operations | 3 | 177 | 109 |
| Operating investments | (45) | (45) | |
| Capital matters as of 31 December | |||
| Totalt assets | 1 648 | 1 568 | |
| Capital employed | 4 | 199 | 400 |
| Equity | 484 | 621 | |
| Equity ratio (%) | 5 | 29% | 40% |
| Net interest bearing debt (cash and cash equivalents) | 6 | 285 | 221 |
| HSE key figures | |||
| Number of employees | 1 705 | 1 861 | |
| Number of man-years | 1 693 | 1 846 | |
| Sick leave | 4.9% | 4.2% | |
| Share related key figures | |||
| Number of shares as of 31 December | 63 863 224 | 63 863 224 | |
| Average number of shares | 63 863 224 | 63 863 224 | |
| Own (treasury) shares | - | - | |
| Share price as of 31 December (NOK) | 7 | 20,6 | 20,8 |
| Market capitalization as of 31 December (NOK million) | 1 316 | 1 328 | |
| Profit per share (NOK) | 8 | 1.1 | 1.6 |
| Cash flow from operations per share (NOK) | 9 | 2.8 | 1.7 |
| Dividend per share (NOK) | 10 | 1.50 | 1.00 |
| Dividend payout ratio | 11 | 134% | 60% |
Definitions
| 1) |
Infratek sold Østlandske Elektro ASA on 30 November 2011. Historical results are shown as profit from discontinued operations according to IFRS.
|
| 2) | Operating margin = Operating profit / Operating revenues |
| 3) | Net cash flow from operations = as defined in the Group cash flow statement |
| 4) | Capital employed = Equity + Net nominal interest bearing debt (cash and cash equivalents) |
| 5) |
Equity ratio = Equity / Total assets
|
| 6) |
Net interest bearing debt (cash and cash equivalent) = Book value of interest bearing liabilities - cash and cash equivalents
|
| 7) |
Share price at the year-end 2011 is based on the latest trade share price in 2011
|
| 8) | Profit per share = Profit for the year / Average number of shares |
| 9) | Cash flow from operations per share = Net cash flow from operations / Average number of shares |
| 10) | Dividend per share = The proposed dividend by the Board of Directos for the accounting year 2011 and actual paid dividend for 2010. |
| 11) | Dividend ratio = The Board of Directors proposed dividend / Profit for the year |


